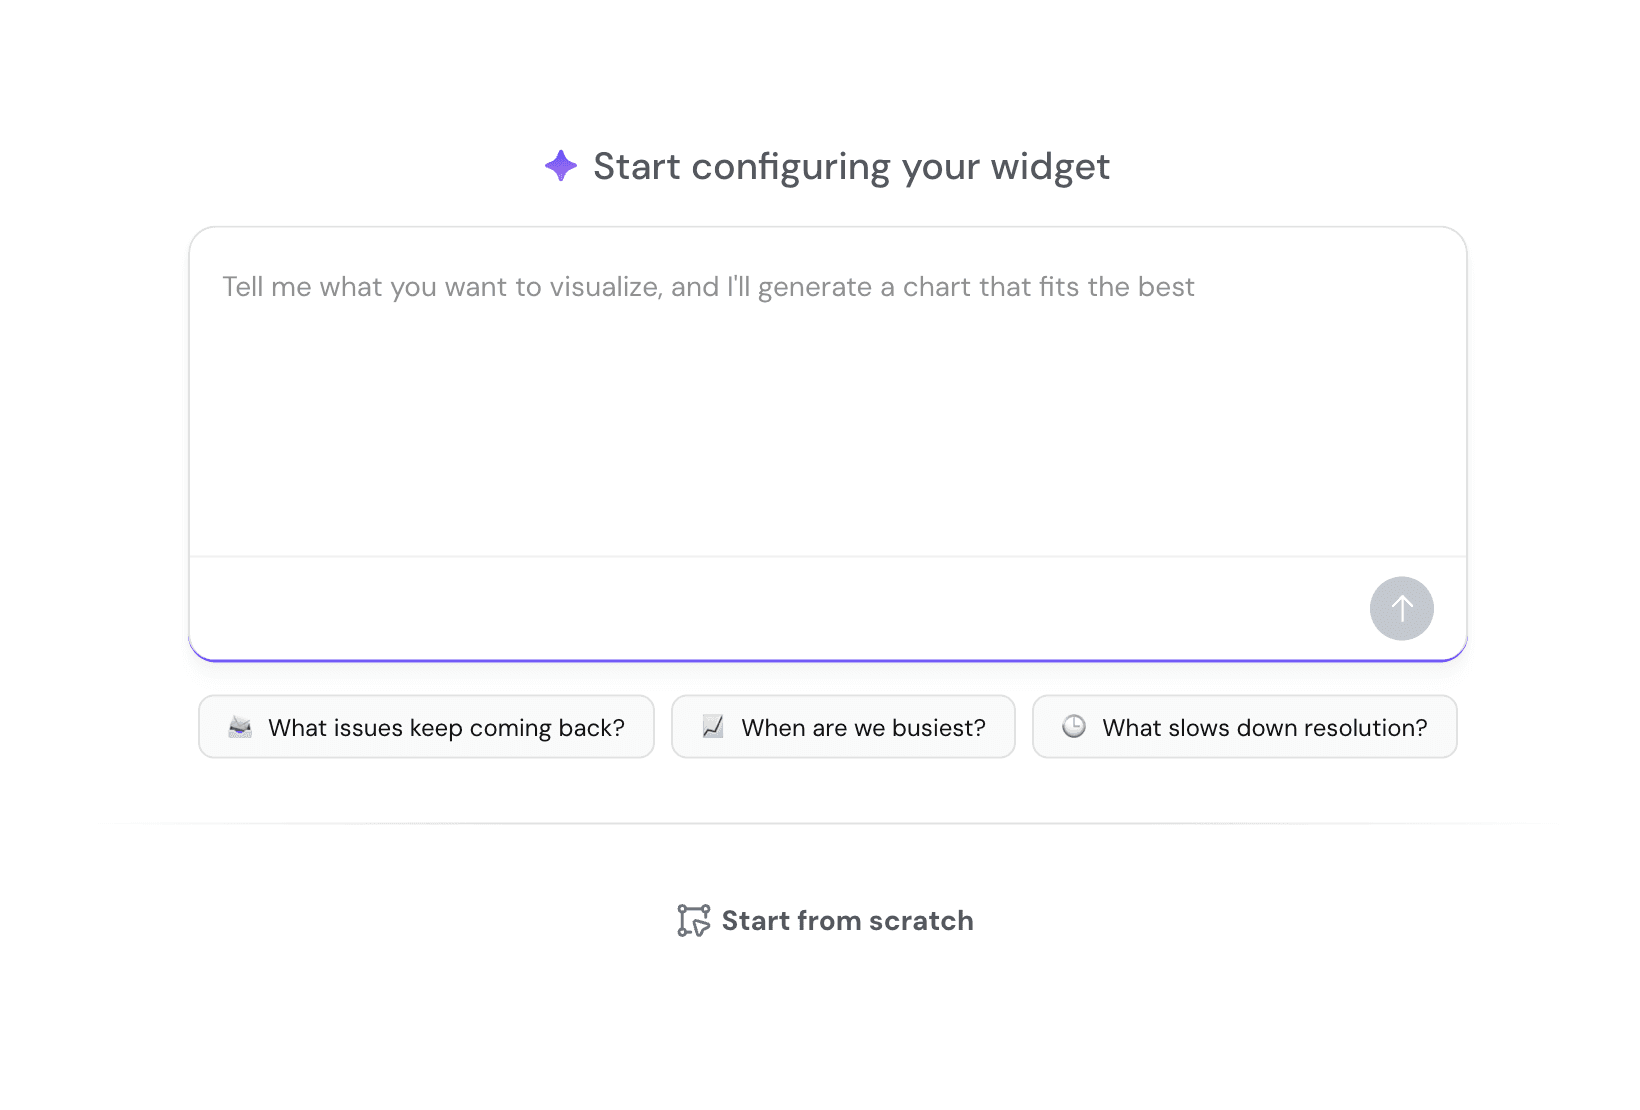
You can now create custom reports in SparrowDesk around the data your team needs to review.
Start with a report, add widgets, and choose what you want to measure. You can group and filter the data, then display it as a KPI, bar chart, line chart, donut chart, or table.